Case study
Outbrain Content Recommendation & Ad Analytics Dashboard
- Inspired by: Outbrain Click Prediction (Kaggle)
- Dataset generator: github.com/avitalglazer/outbrain
Tools & stack
- Tableau
- Python
- Pandas
- NumPy
- ETL
- SQL-style modeling
- Cursor
1. Executive Summary & Objective
This project delivers an end-to-end analytical data pipeline and interactive Tableau dashboard simulating a large-scale content recommendation engine, inspired by the Outbrain Kaggle competition. The objective was to process, model, and visualize 6 months of user navigation telemetry, ad display contexts, and click-through performance to uncover granular daily engagement trends, platform distribution dynamics, and organic traffic seasonality.
2. Data Architecture & Relational Schema
The fully integrated relational data model comprises four primary datasets matching the exact Outbrain schema:
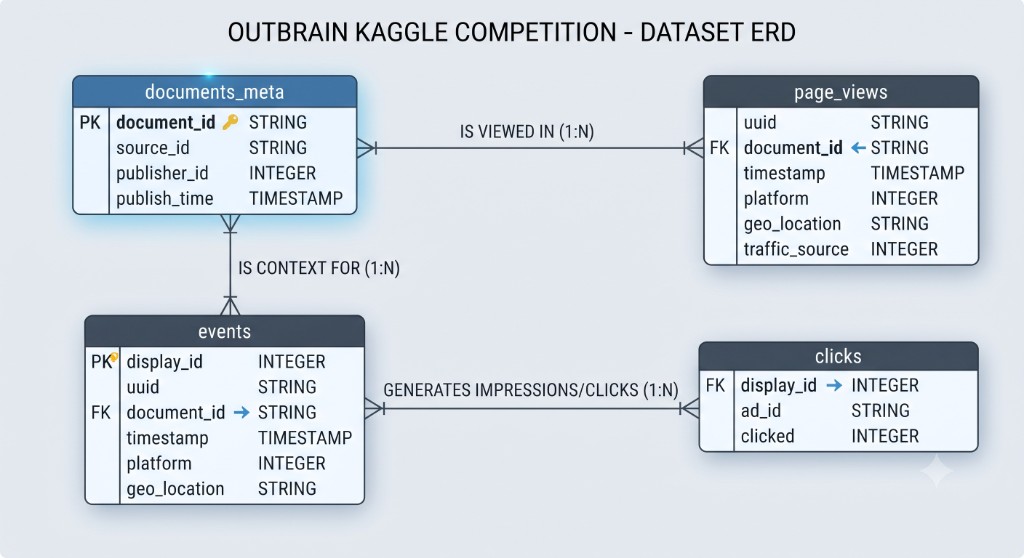
- page_views.csv (10,000 rows, 500 unique users): Tracks comprehensive user navigation telemetry across a 6-month window (September 2025 – March 2026), capturing uuid, document_id, timestamps, device platforms, geo-locations, and traffic sources.
- events.csv (5,200 rows): Captures recommendation widget display contexts (display_id) mapped to specific user sessions, article views, and exact timestamps.
- clicks.csv (15,590 rows): The training set containing candidate ad recommendations (ad_id) per display slot and their binary click outcomes (clicked: 0 or 1).
- documents_meta.csv (50 rows): Content catalog detailing article metadata, source publishers (e.g., CNN, BBC, Reuters, TechCrunch, Figaro), and chronologically aligned publication timestamps.
3. Analysis Plan & Research Questions
These are the product and performance questions the dashboard and SQL-style queries were designed to answer:
- Which platforms drive the most page views and recommendation events over time—desktop, mobile, or tablet?
- How do page views compare across traffic sources (Search, Internal, Social), and which channel leads engagement?
- What does daily seasonality look like for page views and recommendation events, and are there calendar-driven spikes?
- What is the overall and monthly click-through rate (CTR) for recommendation displays?
- Which ads and publisher sources lead in clicks?
Interactive dashboard
Open full size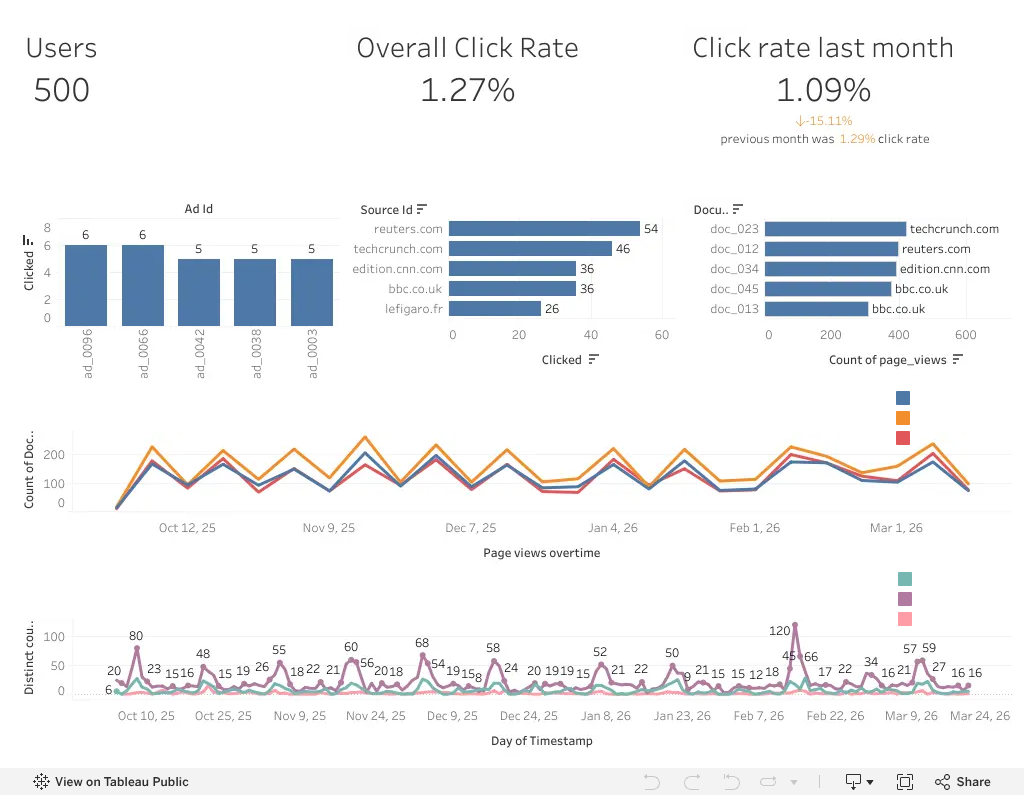
Scroll sideways inside the dashboard if charts look cramped, or open full size.
4. Key Insights & Dashboard Highlights
- Mobile Dominance & Platform Discrepancy: Platform telemetry clearly proves mobile dominance (platform = 2), consistently out-pacing desktop traffic across the timeline. Interestingly, tablet usage (platform = 3) remains exceptionally low compared to mobile and desktop; this structural gap may point to a tracking anomaly or device-identification misclassification in user agent strings rather than organic user behavior.
- Traffic Source Distribution: Comparative analysis across traffic channels reveals that search-driven traffic (Search) consistently drives a higher volume of engagement and page views compared to internal referrals (Internal) and social media (Social).
- Seasonality & Temporal Spikes: Shifting the time-series granularity to a daily view successfully captured organic monthly fluctuations alongside sharp behavioral spikes tied to calendar events—most notably a significant surge in mobile recommendation events on February 14, 2026 (Valentine's Day).
- Data Completeness & Endpoint Drop: The time-series trend concludes with a sharp downward trajectory toward the end of March 2026. This contraction is likely an artifact of incomplete logging or data truncation at the end of the collection window rather than a genuine drop in user demand.
- Industry-Standard Ad Performance (CTR): Evaluated recommendation efficacy against display slots to establish a robust, industry-standard overall Click-Through Rate (CTR) of 1.27% (with monthly comparative benchmarks), aligning perfectly with authentic publisher and AdTech standards.
5. Technical Implementation & Data Engineering
- Synthetic data generation: Built a reproducible Python generator with Cursor that writes the four related CSVs with referential integrity, publish-time constraints, weekday/weekend seasonality, and calendar-driven spikes. The script is open on GitHub.
- ETL & Data Hygiene: Addressed and resolved chronological consistency challenges using Python (Pandas/NumPy) to ensure publication timestamps strictly precede user interaction logs.
- Tableau Modeling: Built multi-table relational joins (1:N and N:1) across core keys (document_id, display_id), leveraging calculated fields, daily date truncations, and native Top-N filters to deliver an executive-ready, high-performance interactive dashboard.